Homelab Uptime Monitoring with Uptime Kuma and Telegram Alerts
Push-based heartbeat monitoring for homelab servers hosted on an external platform, with Telegram notifications for down and recovery events.
Architecture Overview
+---------------------+     heartbeat (HTTPS)     +---------------------+     alert      +---------------------+
|                     |                             |                     |                |                     |
|   Homelab Servers   | -------------------------> |   Uptime Kuma       | -------------> |   Telegram          |
|                     |   scheduled task / cron     |   (PikaPods)        |   bot webhook  |   Channel           |
|   Windows / Proxmox |                             |                     |                |                     |
|   Unraid            |                             |   External cloud    |                |                     |
+---------------------+                            +---------------------+                +---------------------+
Background
I wanted a reliable way to know when any server in my homelab went down – including during internet or power outages that might affect core infrastructure. Hosting the monitoring service inside the homelab would defeat the purpose; if the network goes down, so does the monitor.
The solution was to host Uptime Kuma externally on PikaPods, a low cost managed container hosting platform, so the monitoring service stays reachable regardless of what happens inside the home network.
Rather than having Uptime Kuma reach into my network to poll servers (which would require open ports or a tunnel), each server sends a periodic heartbeat outbound to Uptime Kuma. Uptime Kuma treats a missed heartbeat as a down event. This is the push monitor type built into Uptime Kuma.
Implementation
01 – Deploy Uptime Kuma on PikaPods
Uptime Kuma is available as a one-click app on PikaPods. Deploying it there gives a persistent, publicly accessible instance that runs independently of the homelab network. No ports need to be opened inbound on the home router.
02 – Create a Push Monitor in Uptime Kuma
For each server, a new monitor was added with the type set to Push. Uptime Kuma generates a unique push URL for each monitor. The heartbeat interval was set to 180 seconds – if no ping is received within that window, the monitor trips to Down.
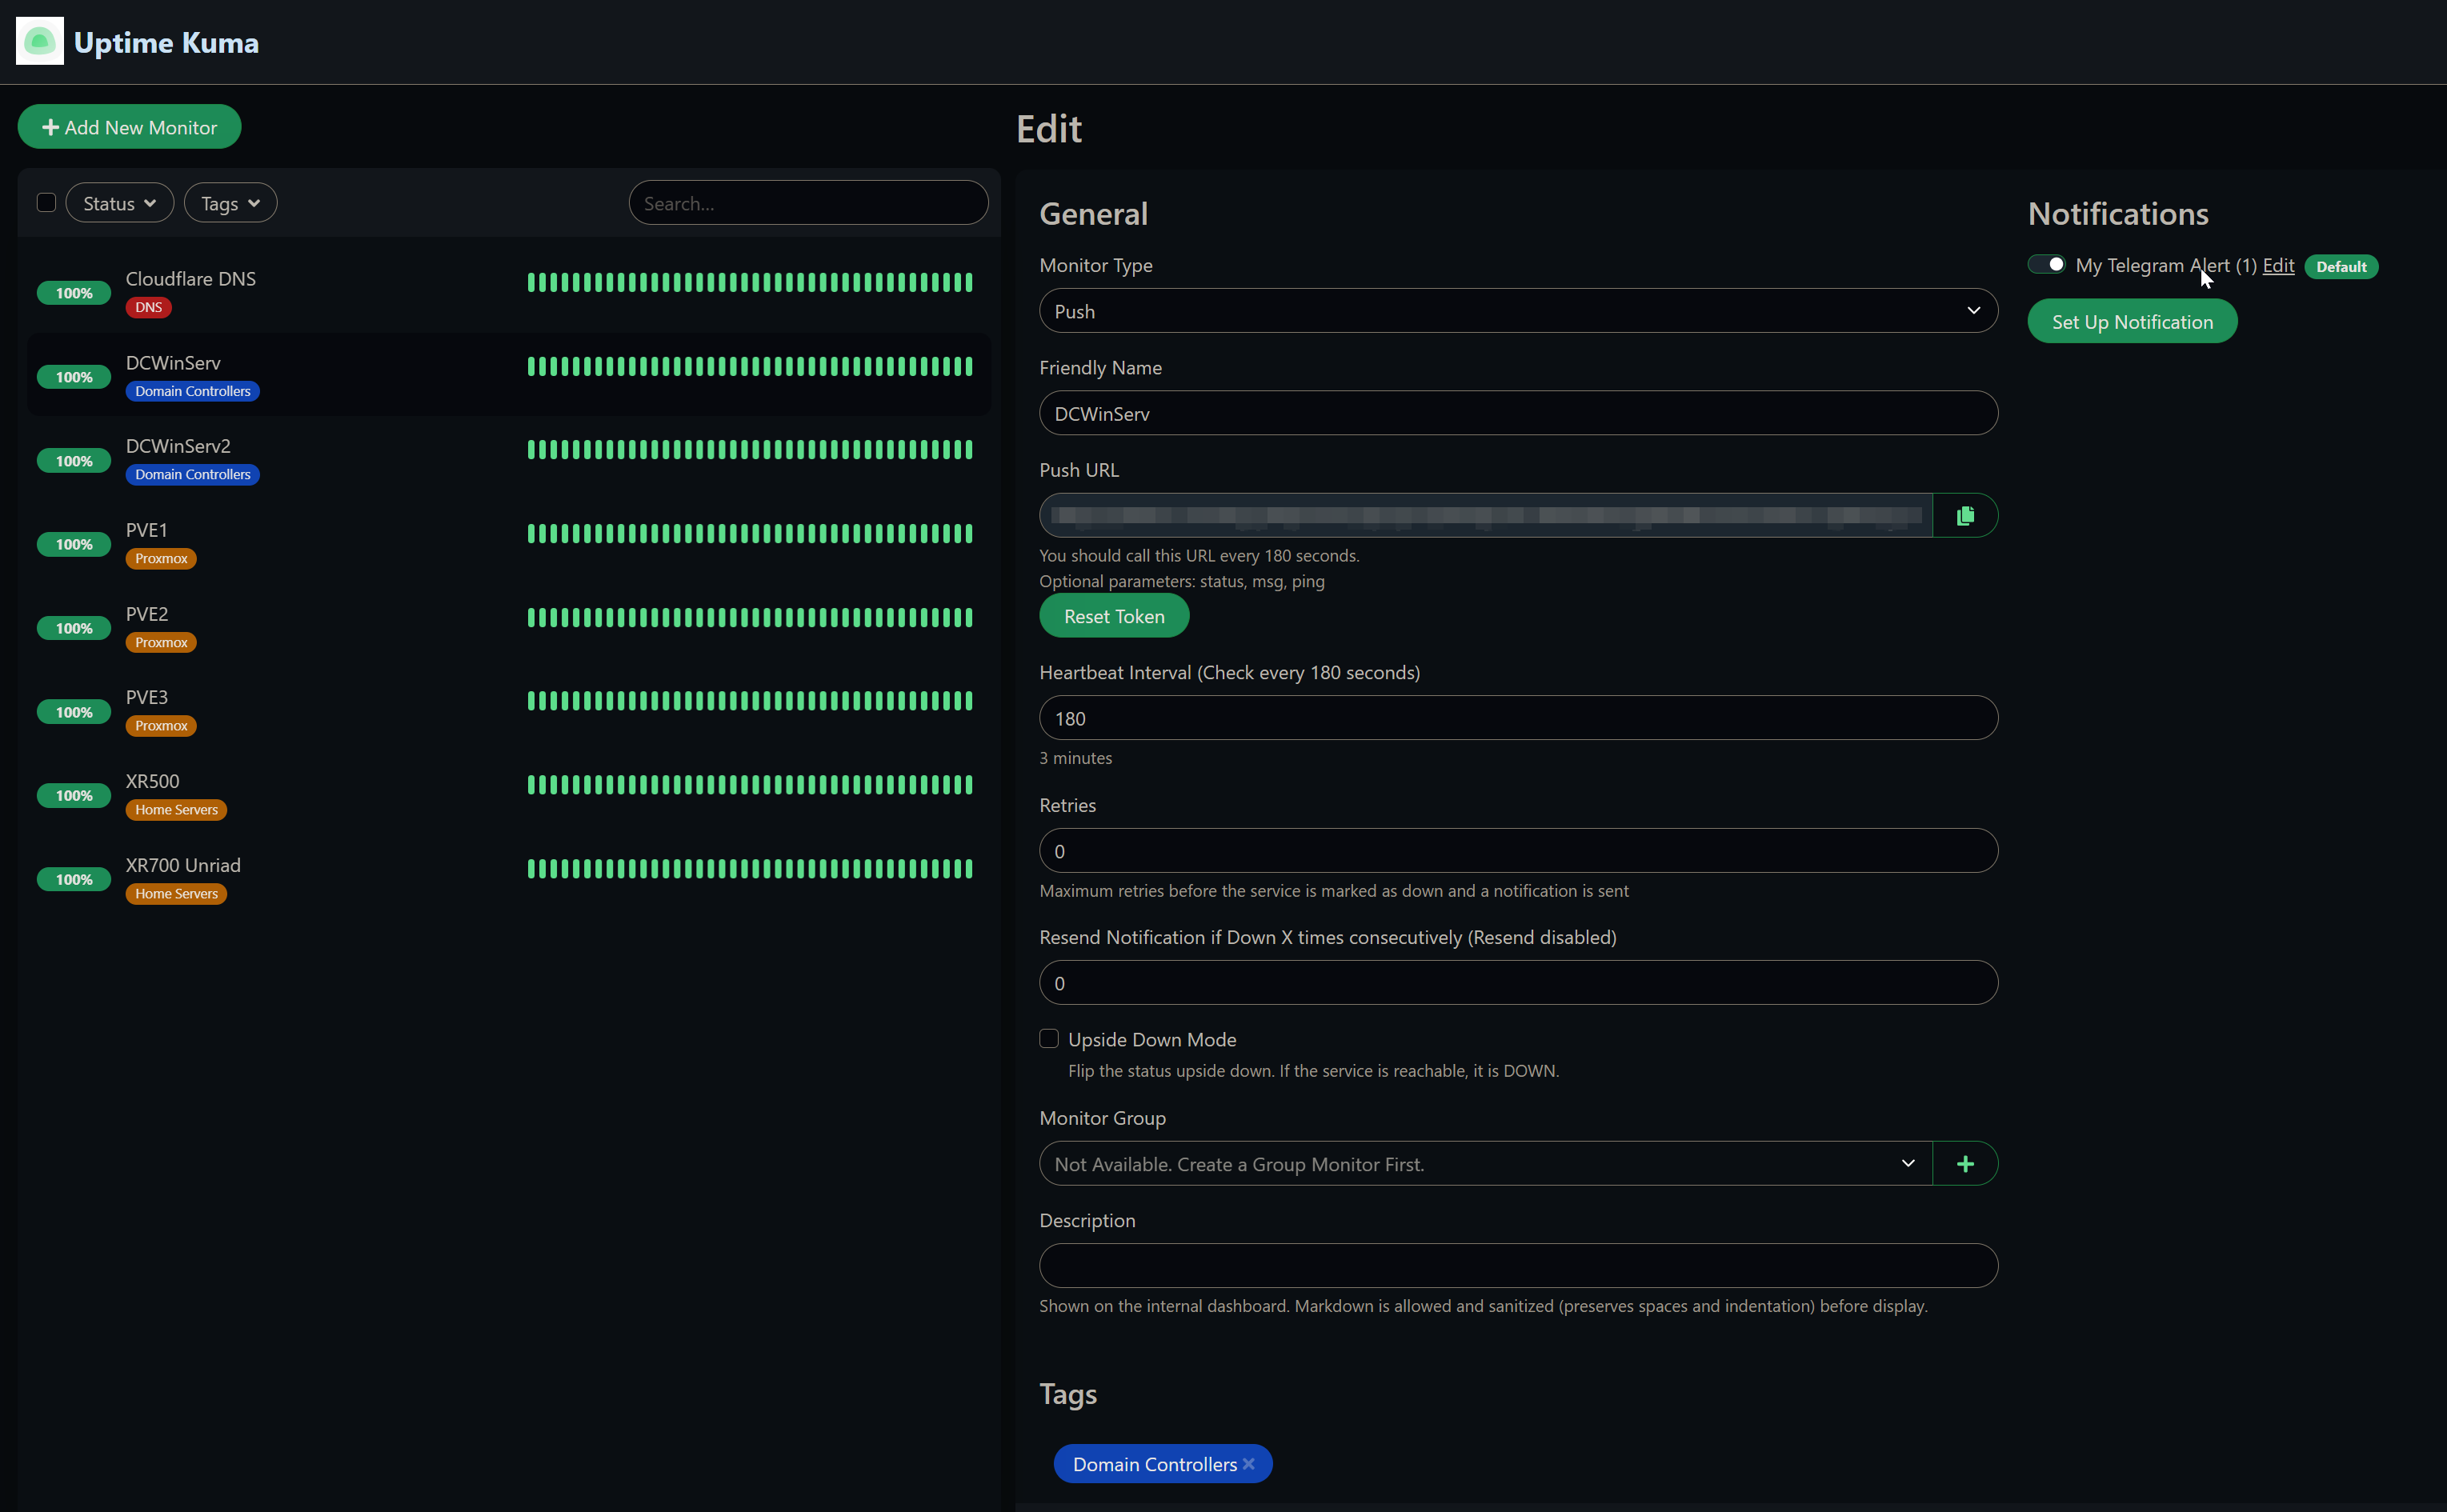
Push monitor config – unique push URL per server, 180 second heartbeat interval
03 – Configure Telegram Notifications
A Telegram bot was created via BotFather and added to a private Telegram channel. In Uptime Kuma’s notification settings, a new notification was created with type Telegram, using the bot token and the channel’s chat ID. With this in place, Uptime Kuma sends a message any time a monitor goes down or recovers.
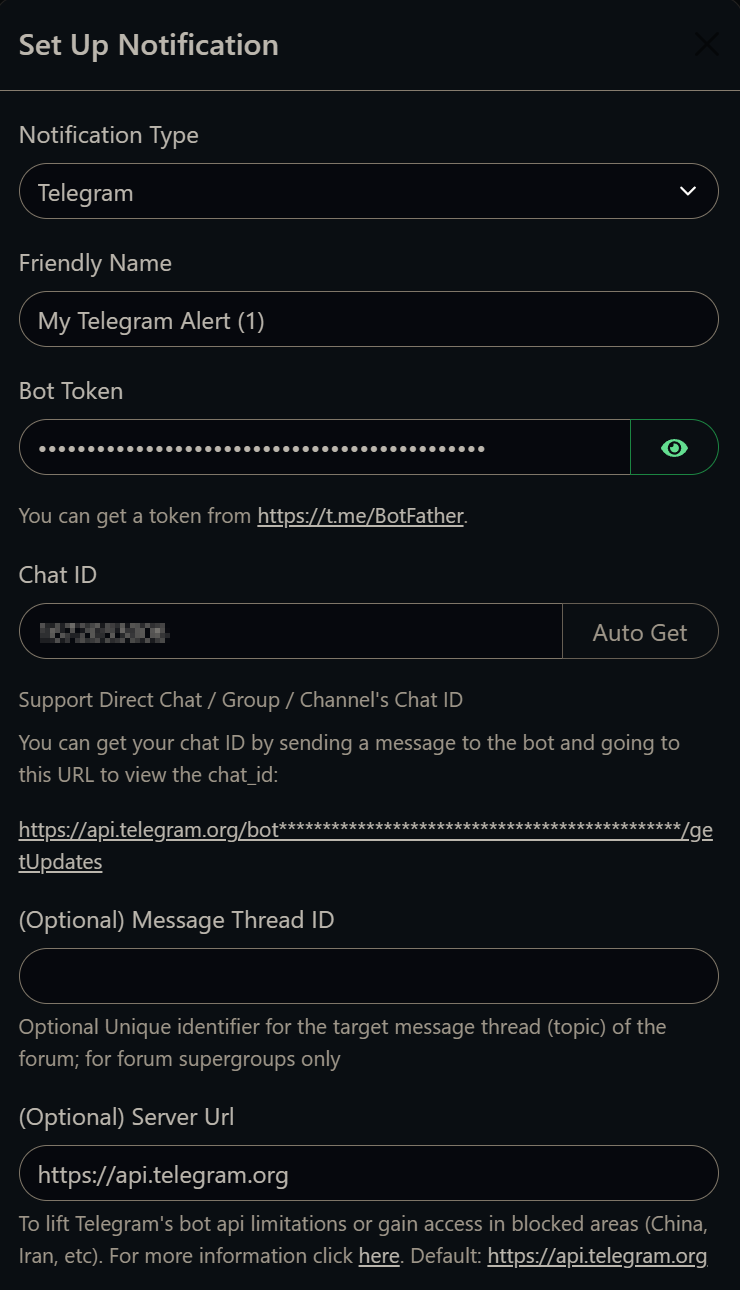
Telegram notification setup – bot token and chat ID are all that’s needed
04 – Schedule Heartbeat Pings on Each Server
Each server type uses a different mechanism to call its push URL on the configured interval.
Heartbeat Scripts
Windows Server – Scheduled Task
A PowerShell script calls the push URL, and a Windows Scheduled Task runs it every minute.
1# push_monitor.ps1
2Invoke-WebRequest -URI "https://your-uptime-kuma-instance/api/push/<token>?status=up&msg=OK&ping="
The scheduled task is registered to run as NT AUTHORITY\SYSTEM, triggers at startup and repeats every minute, and uses IgnoreNew to prevent overlapping instances.
 1$action = New-ScheduledTaskAction `
 2    -Execute 'powershell.exe' `
 3    -Argument '-NoProfile -ExecutionPolicy Bypass -File .\push_monitor.ps1' `
 4    -WorkingDirectory 'C:\path\to\scripts'
 5
 6$trigger = New-ScheduledTaskTrigger -Daily -At (Get-Date)
 7$trigger.Repetition = (New-ScheduledTaskTrigger -Once -At (Get-Date) `
 8    -RepetitionInterval (New-TimeSpan -Minutes 1)).Repetition
 9
10$principal = New-ScheduledTaskPrincipal `
11    -UserID "NT AUTHORITY\SYSTEM" `
12    -LogonType ServiceAccount `
13    -RunLevel Highest
14
15$settings = New-ScheduledTaskSettingsSet `
16    -MultipleInstances IgnoreNew `
17    -Hidden
18
19Register-ScheduledTask `
20    -TaskName 'Push Monitor' `
21    -Action $action `
22    -Trigger $trigger `
23    -Settings $settings `
24    -Principal $principal
Proxmox – Cron Job
On each Proxmox host, a shell script and a cron entry handle the heartbeat.
1# /root/kuma-push.sh
2#!/bin/bash
3curl -s -o /dev/null "https://your-uptime-kuma-instance/api/push/<token>?status=up&msg=OK&ping="
Create the file, make it executable, and add the cron job without opening an editor:
1cat > /root/kuma-push.sh << 'EOF'
2#!/bin/bash
3curl -s -o /dev/null "https://your-uptime-kuma-instance/api/push/<token>?status=up&msg=OK&ping="
4EOF
5
6chmod +x /root/kuma-push.sh
7
8(crontab -l 2>/dev/null; echo "* * * * * /root/kuma-push.sh") | crontab -
Verify the cron entry was added:
1crontab -l
Unraid – User Script
On the Unraid server, the Community Applications User Scripts plugin runs a bash script on a * * * * * schedule (every minute).
1#!/bin/bash
2curl -s "https://your-uptime-kuma-instance/api/push/<token>?status=up&msg=OK&ping=" > /dev/null
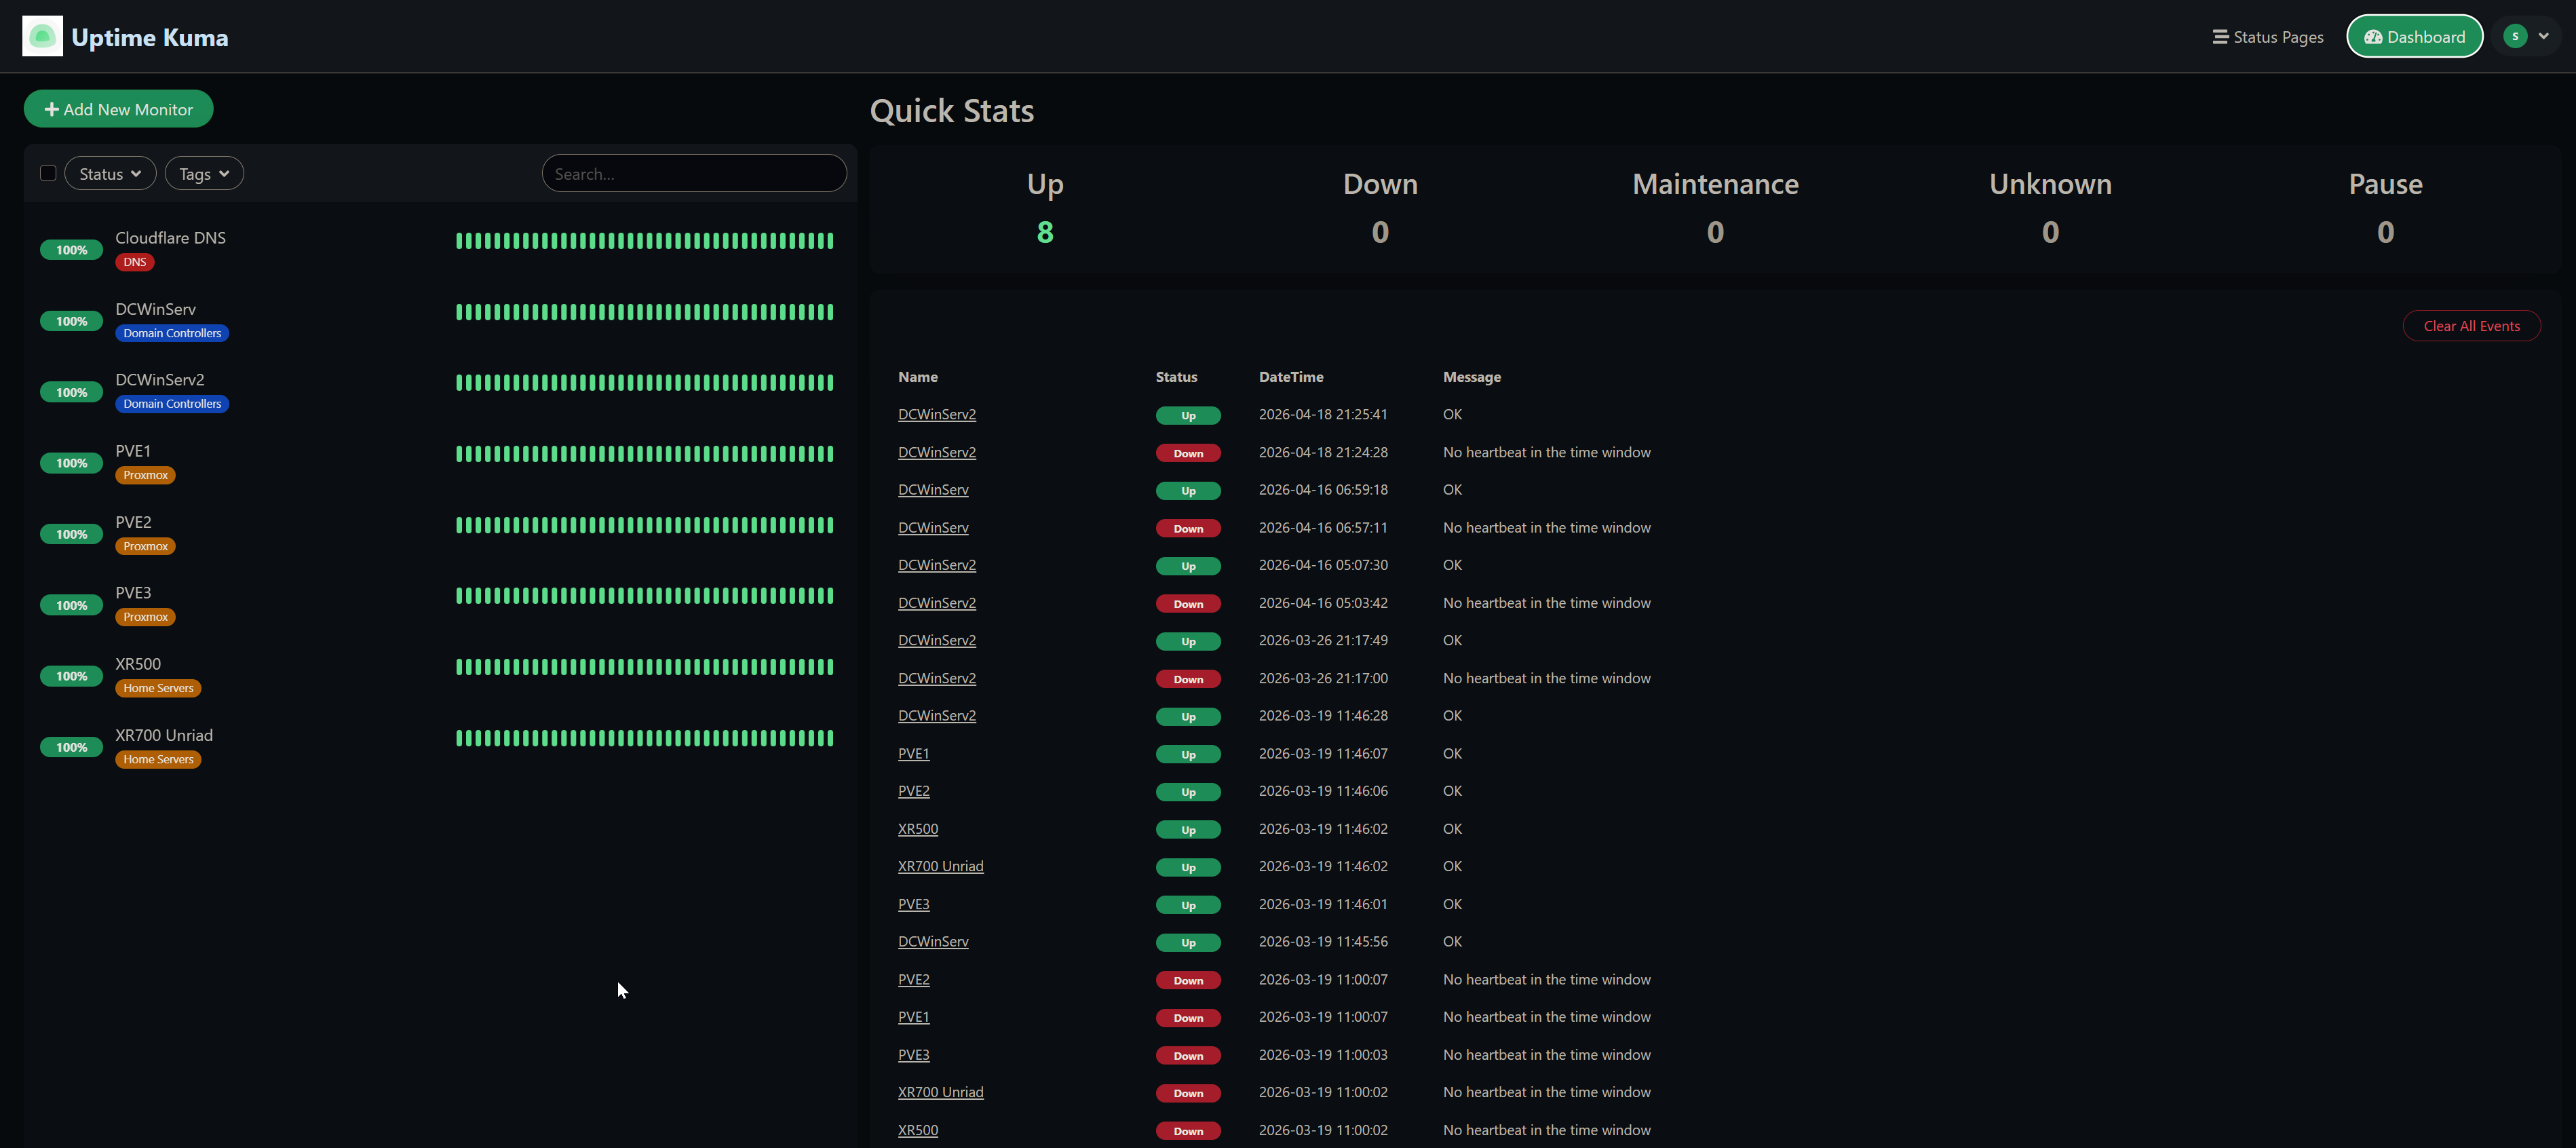
All monitors showing 100% – Cloudflare DNS, domain controllers, Proxmox nodes, and home servers
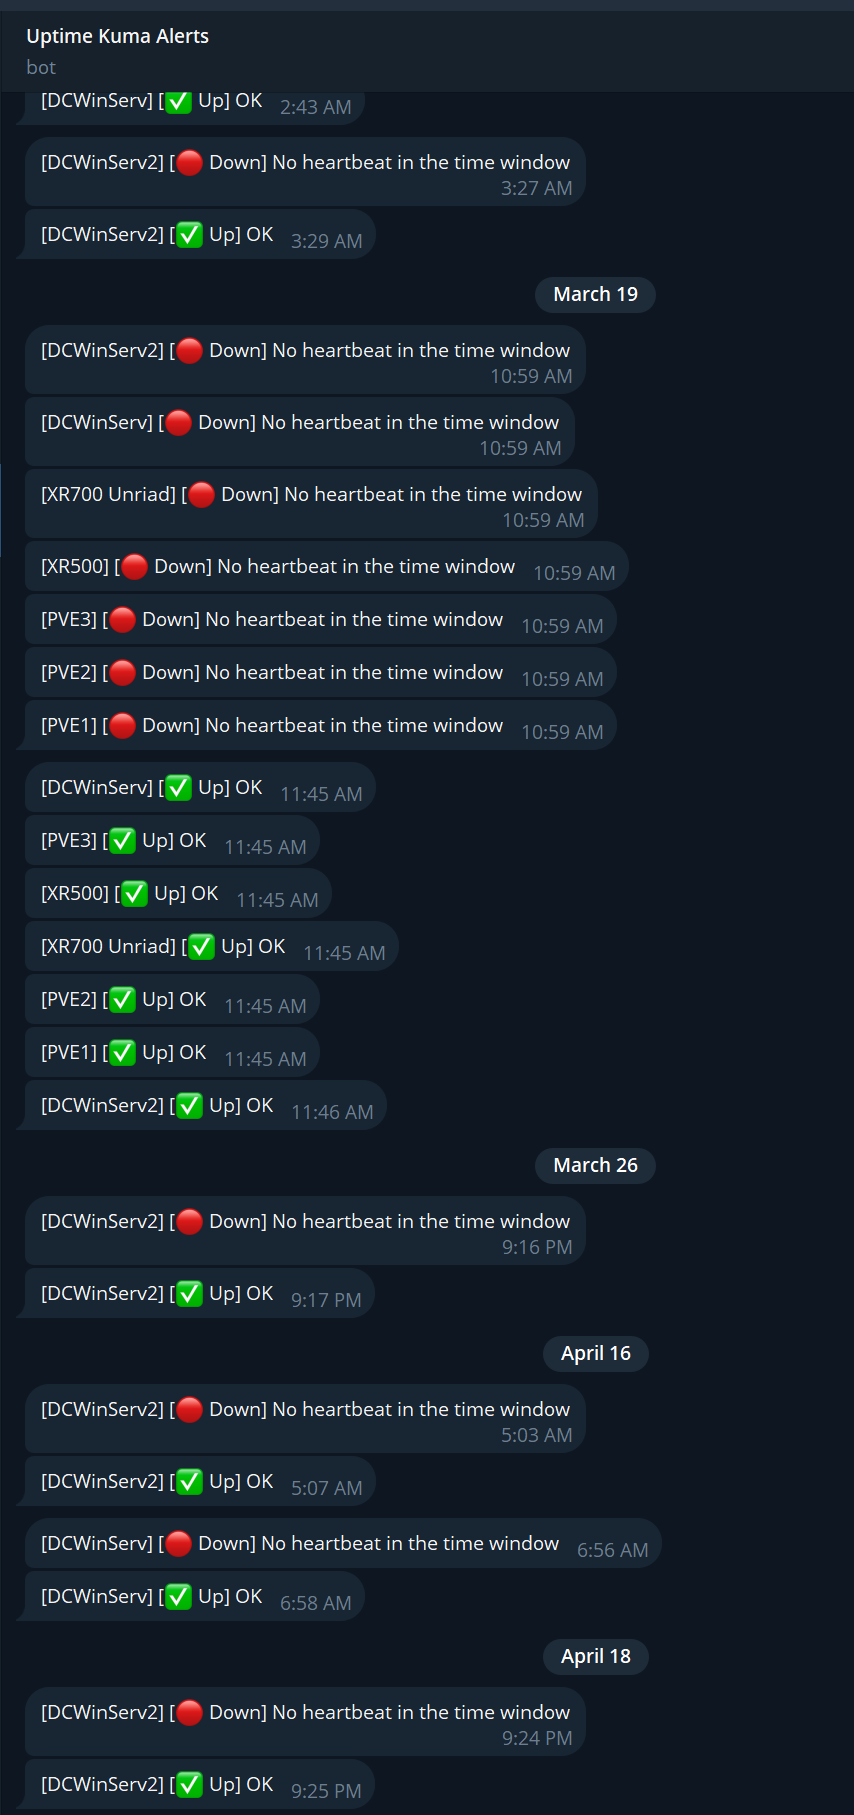
Telegram alerts in action – down and recovery events for each monitored server
Limitations
The push model has one notable blind spot: if the firewall or internet connection goes down, every server loses its path to Uptime Kuma at the same time. All monitors trip to Down simultaneously and Telegram fires an alert for each one – there is no way to distinguish “the internet is out” from “every server crashed at once.”
This reduces alerting granularity in a network-level outage. You get a flood of notifications rather than a meaningful signal about which specific service failed. A more sophisticated setup could add a secondary out-of-band check from a different network path to determine a connectivity outage from a true host failure.
That said, this fits my actual needs. The goal is monitoring and alerting on core infrastructure – domain controllers, Windows DNS, the NAS, and Proxmox hosts. For individual host failures it works exactly as intended, and a mass-down event caused by a connectivity outage is itself worth knowing about, even if the per-host granularity is lost in that scenario.
Outcomes
| Monitoring approach | Push heartbeat – servers call out, no inbound ports required |
| Hosting | PikaPods (external, independent of home network) |
| Alerting | Telegram bot notifications for down and recovery events |
| Server types covered | Windows Server, Proxmox, Unraid |
| Heartbeat interval | 180 seconds |